Thursday February 18, 2021
Graduate Data Network | Data Visualisation
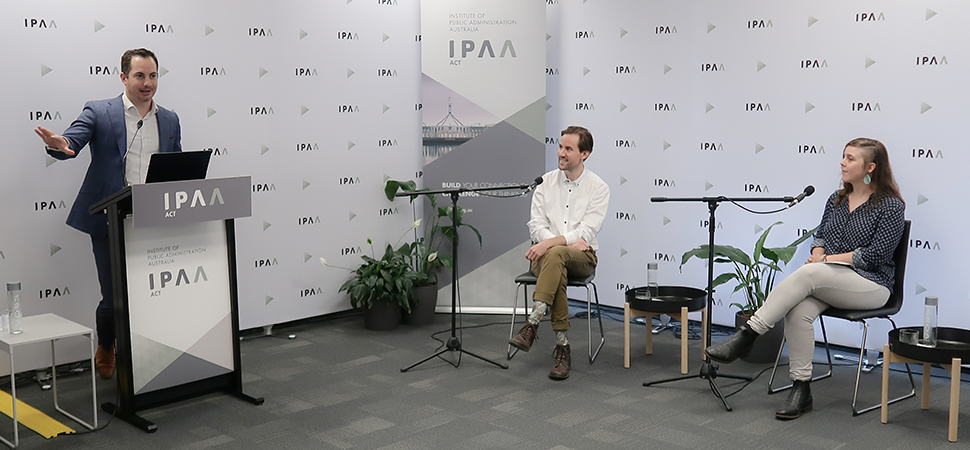
(L-R: Simon Temby, Gavin Styles and Philippa Clark)
The human brain can process visuals 60,000 times faster than it processes text, discerning an image in just 13 milliseconds. In today’s big data saturated landscape, it’s therefore imperative that government organises and simplifies data graphically, to foster an improved understanding of mass information to drive better policy development and outcomes.
Data visualisation is the graphical representation of information and data. It enables us to grasp difficult concepts, identify patterns, and ultimately help us to understand and improve our engagement with others.
This event, featuring Gavin Styles and Pip Clark from the Graduate Data Network (GDN) and guest Simon Temby, Data and AI Specialist from Microsoft Australia, offers an informative and entertaining discussion on:
- The data landscape and data types.
- The five Vs driving data visualisation.
- Data visualisation in a government context.
- Creating engaging and effective data graphics.
Presentation – access Simon’s presentation here.
Download – to listen offline or share within your organisation, an MP3 file of the podcast is available for download here.
Transcript – a transcript of the event is available here.
Video – a video of the event (48 minutes) is available below or can be viewed on IPAA’s Vimeo channel here.
GRADUATE DATA NETWORK
Find out more about the Graduate Data Network:


